
5 Best Practices for Dashboards that Drive Effective Action
Last week we made a case for using data dashboards to visually–and dynamically–communicate the state of your nonprofit’s fundraising efforts on screens across the organization.
This week, we’ll share five best practices in creating (and maintaining) dashboards for major gift fundraising.
But FIRST, a Quick Review of the Benefits of Dashboards
Your fundraising dashboard should deliver powerful benefits like:
- Establishing a goal-driven, performance-based fundraising culture through the clear communication of objectives to the fundraising team–keeping them informed and on track
- Identifying issues or trends that need attention with eye-catching alerts (like putting numbers in RED) when an activity falls short of a goal
- Enabling leadership to make informed decisions and address issues
- Giving fundraisers the ability to take fast action when positive or negative results occur.
Five Fundraising Dashboard
Best Practices
1. Understand the dashboard concept.
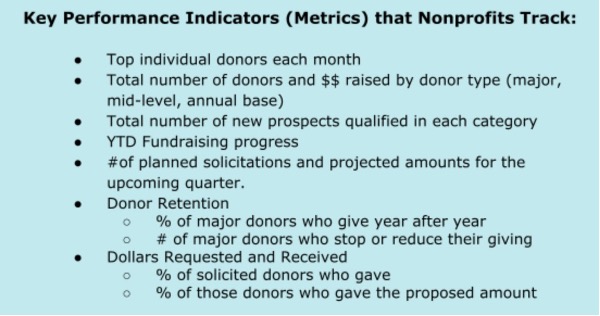
Be sure that your leadership and team know that dashboards can make essential data visual and easily understandable by reporting on crucial factors, benchmarks, and trends. Most importantly, dashboards track Key Performance Indicators (KPIs), quantifiable targets, and milestones related to overall goals.
2. Make dashboards that present the data you use to strategize and drive results.
Once your leadership sets the big goals and KPIs to capture in your dashboards, they need to direct the team to use them to measure progress and discuss strategy.
AND, Dashboards should be interactive. When people want to know more about a data point–and they will–the dashboard should let them quickly dig deeper into the underlying data.
3. Focus on the visuals.
Present the data so that it’s understandable at a glance. Use icons, type, infographics, etc. Consider using colors to alert users to issues. For example, when the amount raised in a given month falls short of the goal, show the data in RED.
4. Provide current, relevant data.
Keep your fundraising dashboard data current to allow any measurements or KPIs to align with your nonprofit’s current struggles/issues visually. The most effective way to keep your dashboard data accurate is to pull all data from your nonprofit’s database of record, or CRM.
5. Make dashboards accessible from a mobile device.
For example, put quick views of critical information on a tablet or mobile phone screen, where most people are already looking. As a result, your dashboards will be more accessible and used more regularly.