
Preparing for GivingUSA 2022
GivingUSA Day is June 21st this year, so mark your calendars! While not a national holiday, for nonprofit professionals like us, it is an important day to celebrate the release of this year’s Giving USA Report. In advance of The DonorSearch Presentation on June 21st at 1:00 PM Eastern, below are some tips and insights from members leadership at The Giving Institute and The Giving USA Foundation.
Ted Grossnickle, the Immediate Past Chair of The Giving Institute and Founder at Johnson Grossnickle and Company, has some good context for the report, “this is the oldest longitudinal study on philanthropy in America, dating back to the 1950s.” Since 2000 statisticians at IU Lilly School of Philanthropy, now under the guidance of Una Osili, crunch numbers with input from the Advisory Council on Methodology to estimate and analyze how many individuals, corporations, and foundations gave and how much they gave to the various sub-sectors of nonprofits in the U.S.
Rick Dunham, The Immediate Past Chair of The Giving USA Foundation and Founder of Dunham and Company, shares, “Reading through Giving USA served as a building block for understanding philanthropy, a key to my success in this industry both as a fundraiser and helpful today as a service provider to philanthropic organizations. An easy way to get a great overview of the data is to review the infographic that shows sources: individuals, corporations, foundations, and bequests and uses or different subsectors such as education, social services, healthcare, etc.”
Below is last year’s infographic; you’ll have to wait until June 21st to see the new infographic. In 2020 The United States gave over $400 billion for the third consecutive year. Here are some of the key takeaways from last year:
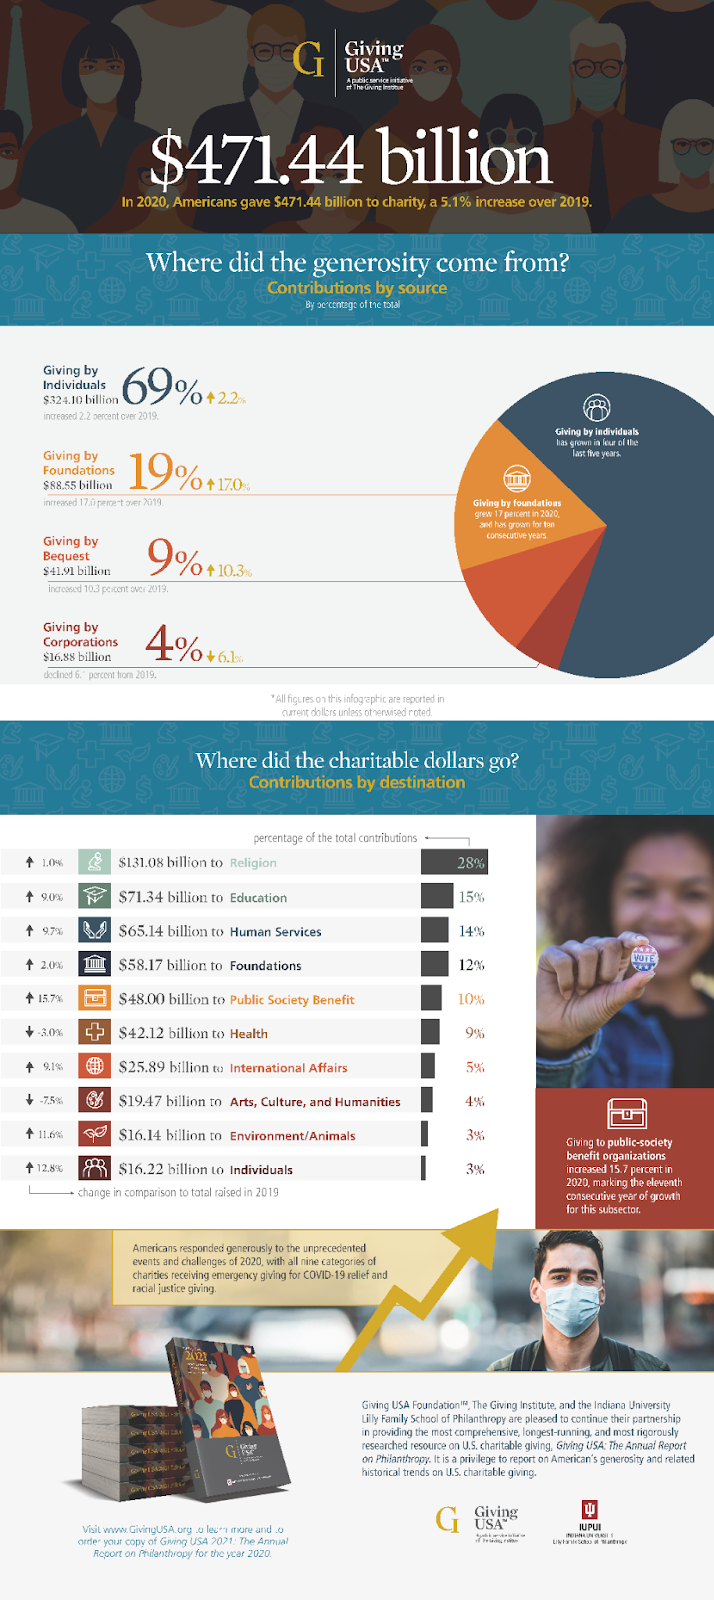
- In 2020, Americans gave over $471 billion to charity, that’s over a 5% increase over 2019
- Foundation giving increased by 17%, and they responded to the need brought on by the COVID-19 pandemic. Later this month, we’ll find out if this continued in 2021.
- Bequest giving increased by over 10%. Unfortunately, some of this increase is due to COVID-19-related deaths. Nevertheless, the increase in bequests highlights the importance of getting in front of long-term donors.
- Giving by corporations decreased by over 6%. In a virtual world, there are fewer corporate sponsors. If your organization relies on events, it may be time to emphasize individual giving.
- Giving to education increased by 9% to over $71 billion, while giving to health was down 3% to $42 billion. However, remember that gifts to academic healthcare count towards education, not health, so these numbers are a little misleading.
- Giving to Public Society Benefit, Environmental and Animal organizations, and gifts directly to individuals all increased by over 10%
The current Chair of The Giving USA Foundation, Laura MacDonald, Founder of Benefactor Group, wants you to know you can learn much more from the 400+ pages of the book than you can from the infographic. Here are some of her tips for using the data:
- First, share the data with your board, so they understand how the U.S. gives.
- Review the four chapters on sources of giving, regardless of how your organization currently receives funding.
- Look at your sector chapter(s); Each sub-sector of giving in the U.S. has a unique chapter. For example, if you are a higher ed org, look at giving to education and perhaps review other relevant sectors (arts if you have a strong arts program and healthcare if your school is involved in academic medicine).
- Spend time in the practitioner’s highlights section within each chapter. Again, there are great recommendations from the editorial review committee.
- Reread different sections from time to time, like any good book or movie; the more you engage, the more you will learn.
Communicating this data with your board is essential. Brenda B. Asare, Vice-Chair of The Giving Institute and President & CEO of Alford Group, has helpful tips on how to present this to your board:
- Create an analysis showing the four sources of giving for your organization so you can compare them to the national numbers. You should segment all realized, hard credited gifts into four categories:
- Individuals
- Corporations
- Foundations
- Bequests
- Put this data into a pie chart similar to how GivingUSA presents the data.
- Review your pie to understand your organization’s funding sources and where to place additional focus.
Lead the board in discussing the differences and similarities and , where growth opportunities lie to generate more relationships and generosity. ,
As the leader of your development team, it’s your responsibility to synthesize this data for your board and the rest of your organization so they may make informed decisions. Below are four key steps to do this from Ted Grossnickle. First, pay attention to the release. GivingUSA goes live on June 21st, so make sure you get the report or attend one of the many presentations. Normally, there are civic, in-person events across the country, but many events are online this year. You will also be able to join other online presentations from many of the 50+ Giving Institute firms.
- Plan a special update to your board
- In late June so you can share what you have learned. Make sure it’s on the calendar and have materials and takeaways prepared.
- Use GivingUSA as context for other research studies you come across. Other studies typically focus on one specific piece of giving in our country. Synthesizing findings from multiple studies helps us glean deeper insights and apply new information in more meaningful ways.
- Focus on key takeaways. Reviewing the numbers a few times, you can understand the key talking points to ensure you are well prepared.
Remember to set placeholders on your calendar to attend some online presentations. Many of these presentations are free on June 21st and the following weeks. The GivingUSA website has a list available online. Encourage board members to attend these presentations as well. Allocate time to read the report in late June so you can plan to discuss it with your board, colleagues, and others. One fun way to cover much of the data is to have different members of your development team or local AFP-Chapter read different chapters and report back.
You can subscribe to Giving USA today to receive access to this year’s Giving USA Report and so much more. The Key Findings and Numbers Chapter are available on June 21st. The full book will come out shortly after. The exciting part of subscribing is that you get more than this year’s report. You will receive access to the below special reports released previously:
o Leaving a Legacy: A New Look at Planned Giving Donors
o The Evolution of Workplace Giving
o Donor Advised Funds
o Giving to Religion
o Giving in the Golden Years
Thanks to one of our donors, Salesforce, you can access the data in Tableau. The last 5-years of data can be accessed by anyone. Subscribers can look at all of the historical data. The editable Tableau reports allow you to glean more valuable insights. The report is brought to you by Giving USA’s generous donors. If you would like to support The Giving USA Foundation this link will take you to the donation page.
If you subscribe to receive the report before June 21st, 2022, you will receive a 15% discount!
Now the question is, will you join us on June 21st to go through the high takeaways of this year’s Giving USA Report?