
Nonprofit Analytics: How to Harness Data and Amplify Impact
If you feel like your nonprofit is drowning in data or you’re unsure how to use it, you’re not alone. An astounding 76% of nonprofits report not having a comprehensive analytics strategy, which highlights a critical gap in data-driven decision-making across the sector.
Without the right tools and strategies, data overload can overwhelm your team and stall progress. But what if you could turn that chaos into clarity?
An effective approach to nonprofit analytics will transform raw data into smart decisions, unlocking new opportunities for program growth, supporter engagement, and measurable impact. In this guide, we’ll help you harness your nonprofit’s data by covering these essential topics:
- The Basics of Nonprofit Analytics
- How Nonprofit Analytics Solves Common Problems
- Essential Data Analytics for Nonprofits to Track
- How to Implement Analytics at Your Organization
- How DonorSearch Can Streamline Your Nonprofit’s Analytics
The tools you choose form the foundation of your nonprofit’s data analytics approach, enabling you to track, analyze, and leverage your collected information effectively. With that in mind, let’s talk about the basics of nonprofit analytics—what it is, how it works, and why it matters.
The Basics of Nonprofit Analytics
What is nonprofit analytics?
Nonprofit analytics is the process of collecting, managing, and analyzing data generated by individual nonprofit organizations. It involves examining various types of information—such as donor behavior, program outcomes, and fundraising effectiveness—to inform strategic decisions, optimize resource allocation, and amplify your organization’s impact.
Key processes that fall under the umbrella of nonprofit analytics include:
- Data collection involves gathering relevant data from multiple sources, such as donor databases, program reports, website analytics tools, volunteer management platforms, prospect research solutions, online forms, and surveys.
- Data management encompasses the cleaning and storage of data to ensure accuracy and consistency. This includes data validation, de-duplication, and upholding security standards.
- Data analysis means applying statistical and analytical techniques to identify trends, patterns, and insights. This might range from simple descriptive statistics to advanced predictive modeling.
- Reporting involves presenting nonprofit data in an understandable format, such as dashboards, charts, reports, or infographics. These materials help team members and stakeholders interpret findings and make informed decisions.
- Action means using insights to inform strategic planning, improve outreach, optimize program delivery, or make other improvements.
- Monitoring and evaluation is the final stage in the nonprofit analytics cycle, which describes continuously tracking metrics to measure progress, assess impact, and adjust strategies.
Together, these processes form a cycle that helps your nonprofit craft strategies tailored to its cause and supporters.
What are the major types of nonprofit analytics?
To move from gut feelings to data-backed strategies, you need to understand how different types of nonprofit analytics help you make smarter decisions. Here is a breakdown of four core types of data analytics every nonprofit should use:
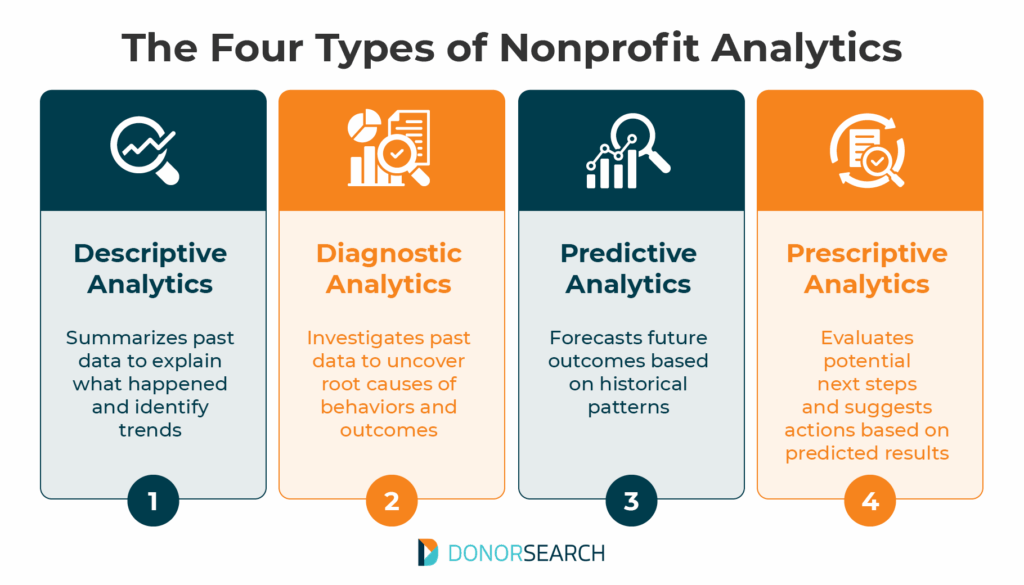
- Descriptive analytics describe past performance, telling you what happened. This type summarizes historical data to identify trends and patterns. For example, you might review last year’s donation totals for each month to identify peak giving seasons.
- Diagnostic analytics dig deeper into your data to explain the root causes of behaviors and outcomes, explaining why something happened. For example, if your youth mentorship program shows lower graduation rates than last year, diagnostic analytics might reveal that decreased mentor availability or a shift in participant demographics contributed to the change.
- Predictive analytics use historical patterns and data modeling to forecast future outcomes, saying what will likely happen. For example, predictive models might identify which donors are most likely to give again based on giving frequency, recency, or engagement behaviors.
- Prescriptive analytics recommend next steps based on predictive insights, telling you what you should do next. These tools often simulate and evaluate different strategies’ potential impact. For example, if you need to fill shifts for an upcoming community event, prescriptive analytics might analyze volunteer availability, past participation, and skillsets to recommend which volunteers to contact first and how to personalize outreach.
Each type builds on the previous: you start by understanding what happened (descriptive), explore why (diagnostic), predict what’s next (predictive), and then choose the best course of action (prescriptive). Together, these analytics form the foundation for smarter decisions for your mission.
Why does data analytics matter for nonprofits?
By leveraging analytics, your nonprofit can move beyond intuition to make data-driven choices that enhance efficiency, engagement, and sustainability.
Here are the key benefits of a smart approach to nonprofit data analytics:
- Finding Major Donor Prospects: Analytics helps identify potential donors who are most likely to support your cause by analyzing giving patterns, wealth indicators, and engagement history.
- Boosting Operational Efficiency: Nonprofit analytics help understand resource allocation, workflow bottlenecks, and cost drivers, helping to streamline operations and reduce waste.
- Optimizing Outreach: By tracking which channels, messages, and campaigns resonate, your nonprofit can tailor its communications to maximize response rates.
- Improving Individual Fundraising Asks: Data-driven insights allow you to personalize solicitations based on donor preferences, giving capacity, and past behavior, increasing the likelihood of successful asks.
- Strengthening Program Outcomes: Analyzing program data helps you measure results, identify what’s working, and make evidence-based adjustments.
- Improving Storytelling: Using real data to craft compelling narratives strengthens appeals and stakeholder communications by demonstrating transparency and measurable impact.
- Enhancing Funding Proposals: Analytics provides concrete evidence of your nonprofit’s impact, enabling you to write strong grant proposals and sponsorship requests that increase your chances of securing funding.
From improving day-to-day efficiency to crafting more compelling appeals, harnessing your data can significantly amplify your nonprofit’s impact. However, it’s important to stay up-to-date on the leading data collection and analysis methods to turn these benefits into reality.
How are nonprofit data analytics changing?
Nonprofit data analytics are evolving rapidly as organizations shift from manual data collection and reporting to more sophisticated, technology-driven approaches.
Supporter expectations are rising, and organizations that embrace transparency, such as by sharing impact data, receive 53% more in contributions on average. To meet demands for greater transparency, nonprofits are moving beyond guesswork and anecdotal evidence. They’re increasingly leveraging real-time data, predictive insights, and purpose-built AI tools to make smarter decisions.
Technology now enables nonprofits to automatically collect, analyze, and report on complex data, replacing the need for manual tracking. While reporting basic metrics like fundraising revenue and the number of people served used to be the limit, nonprofits can now uncover deeper insights into program effectiveness and stakeholder engagement.
As this technology becomes central, nonprofits must also prioritize the responsible and ethical management of data, especially when using AI. This shift enables nonprofits to create more meaningful, longer-lasting impacts on their communities.

How Nonprofit Analytics Solves Common Problems
Nonprofits grapple with several key challenges that limit their effectiveness. Fortunately, smart use of data analytics can address these issues head-on—let’s look at a few common scenarios as examples.
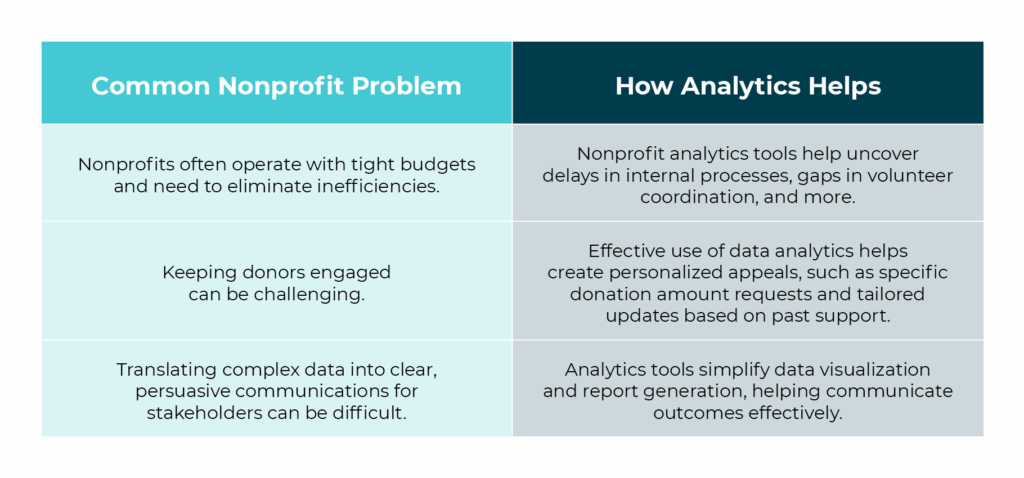
1. Limited Budgets
Nonprofits often operate with tight budgets, making it essential to identify and eliminate inefficiencies. The right nonprofit analytics strategies can reveal hidden challenges like delays in internal processes, duplicated efforts across teams, gaps in volunteer coordination, and even areas where you can reduce spending without negatively affecting results.
Fortunately, affordable analytics tools empower teams of all sizes to harness data effectively without heavy investment or specialized expertise. Over time, this can help your organization use resources more effectively and create more flexibility in your budget.
2. Donor Retention Challenges
Keeping donors engaged can be difficult without a personalized approach. Effective use of data analytics allows you to segment your donor base and tailor communications based on individual preferences and giving history.
For instance, you might personalize your outreach by:
- Sending donation requests for specific amounts aligned with past giving
- Sharing updates or soliciting support for programs that donors have previously funded
- Inviting individuals to events similar to those they have attended before
Personalized engagement shows you’re paying attention to donors’ preferences and motivations, fostering longer-lasting relationships.
3. Communicating Program Impact
While many nonprofits understand the importance of demonstrating their impact, translating complex data into clear, persuasive communications is often easier said than done. Funders and stakeholders expect transparent and accessible reporting that tells a meaningful story—not just numbers on a page.
Analytics tools help overcome this hurdle by simplifying data visualization and report generation. With these tools, your organization can craft compelling presentations that highlight outcomes, engage supporters emotionally, and build lasting trust. This clarity and transparency not only satisfy funder requirements but also strengthen your nonprofit’s overall reputation.
Essential Data Analytics for Nonprofits to Track
With solid foundational knowledge, let’s look at some metrics your team should be tracking. This list isn’t exhaustive, but it will give you a solid starting point for tracking performance and making informed decisions.
Fundraising and Donor Analytics
- Affinity to Give: A measure of how closely a donor’s interests and past giving align with your nonprofit’s mission or specific programs, based on factors like a love for your cause and involvement in your nonprofit’s activities like events, volunteering, or advocacy
- Average Donation Amount: The average value of individual donations received over a specific period, calculated by dividing the total amount of donations by the number of gifts
- Average Donation Amount = Total Donations / Number of Gifts
- Capacity to Give: An estimate of a donor’s financial ability based on wealth indicators such as real estate ownership, stock holdings, and political giving
- Cost Per Dollar Raised (CPDR): The amount of money spent to raise each dollar, reflecting the efficiency of fundraising efforts
- CPDR = Fundraising Expenses / Total Funds Raised
- Donor Acquisition Cost: The total cost of acquiring a new donor, including mass marketing, events, and personalized outreach expenses
- Donor Lifetime Value (LTV): The projected total amount a donor is expected to contribute over the entire duration of their relationship with your nonprofit
- LTV = Average Donor Lifespan x Average Donation Amount x Average Donation Frequency
- Donor Retention Rate: The percentage of donors who continue giving to your nonprofit from one period (year, campaign, etc.) to the next, indicating how well your organization cultivates donor relationships
- Retention Rate = Number of Donors Who Gave in Both Periods / Number of Donors in Previous Period x 100
- Lapsed Donor Rate: The percentage of donors who stop giving during a specified period
- Lapsed Donor Rate = Number of Donors Who Stopped Giving / Total Donors in Previous Period x 100
- Major Gift Potential: The likelihood that an individual will make a major donation, based on a combination of their financial capacity and affinity for your cause
Digital Marketing Analytics
- Advertising Cost Per Click (CPC): The average amount spent on advertising for each click received, used to evaluate the cost-effectiveness of paid campaigns
- CPC = Total Advertising Spend / Number of Clicks
- Bounce Rate: The percentage of visitors who leave your website after viewing only one page, indicating a lack of engagement
- Bounce Rate = Number of Single-Page Visits / Total Number of Website Visits x 100
- Conversion Rate: The percentage of website visitors who complete a desired action (such as donating or registering for an event) out of the total visitors
- Conversion Rate = Number of Visitors Who Completed Desired Action / Total Number of Visitors x 100
- Email Click-Through Rate: The percentage of email recipients who click on at least one link within an email
- CTR = Number of Email Recipients Who Clicked a Link / Number of Emails Delivered x 100
- Email Open Rate: The percentage of email recipients who open the email, measuring the effectiveness of your subject lines and sender reputation
- Open Rate = Number of Email Recipients Who Clicked a Link / Number of Emails Delivered x 100
- Organic Search Traffic: Visitors who arrive at your website through unpaid search engine results, reflecting the effectiveness of your SEO efforts
- Referral Traffic: Visitors who find your website through links on other websites, such as partner organizations’ sites or social media
- Session: A single visit to your website by a user, which may include multiple page views and interactions within a set time frame (e.g., 30 minutes of inactivity or when the user leaves)
- Session Duration: The average length of time users spend on your website during a single session
- Session Duration = Total Duration of All Sessions / Number of Sessions
- Social Media Engagement: The number of interactions (likes, shares, comments) your social media content receives, which you can measure per post or over a certain period of time on a specific platform (e.g., how many total likes your Instagram posts received in the month of May)
- Traffic Sources: The different channels through which visitors arrive at your website, such as direct visits, organic search, paid ads, or referrals
Program and Operational Analytics
- Cost Per Beneficiary: The average cost to serve each beneficiary
- Cost Per Beneficiary = Total Program Costs / Number of Beneficiaries Served
- Participant Reach: The number of individuals your programs serve
- Program Outcomes: Measurable changes or achievements resulting from your programs (e.g., graduation rates, health improvements, pet adoptions)
- Participant Satisfaction: Qualitative data such as feedback and ratings from program beneficiaries, often collected via surveys
- Resource Allocation: How financial and human resources are distributed across programs and operations
- Social Return on Investment (SROI): The broader social value or impact generated per dollar invested in programs, calculated by assigning monetary values to projects to evaluate the social, economic, or environmental value those programs create
- SROI = Social Value Created in Monetary Terms / Investment in Program
- Staff Turnover Rate: The rate at which employees leave your organization within a certain time period, typically calculated annually
- Staff Turnover Rate = Number of Employees Who Left During Period / Total Number of Employees During Period x 100
- Volunteer Participation in Programs: The number of volunteers and work hours directly involved in program delivery
- Volunteer Retention Rate: The percentage of volunteers who continue their involvement from one period to the next, calculated similarly to donor retention
How to Implement Analytics at Your Organization
Implementing nonprofit data analytics doesn’t have to be overwhelming. The key is to start with a clear plan and scale steadily. Here is how to get started at your nonprofit:
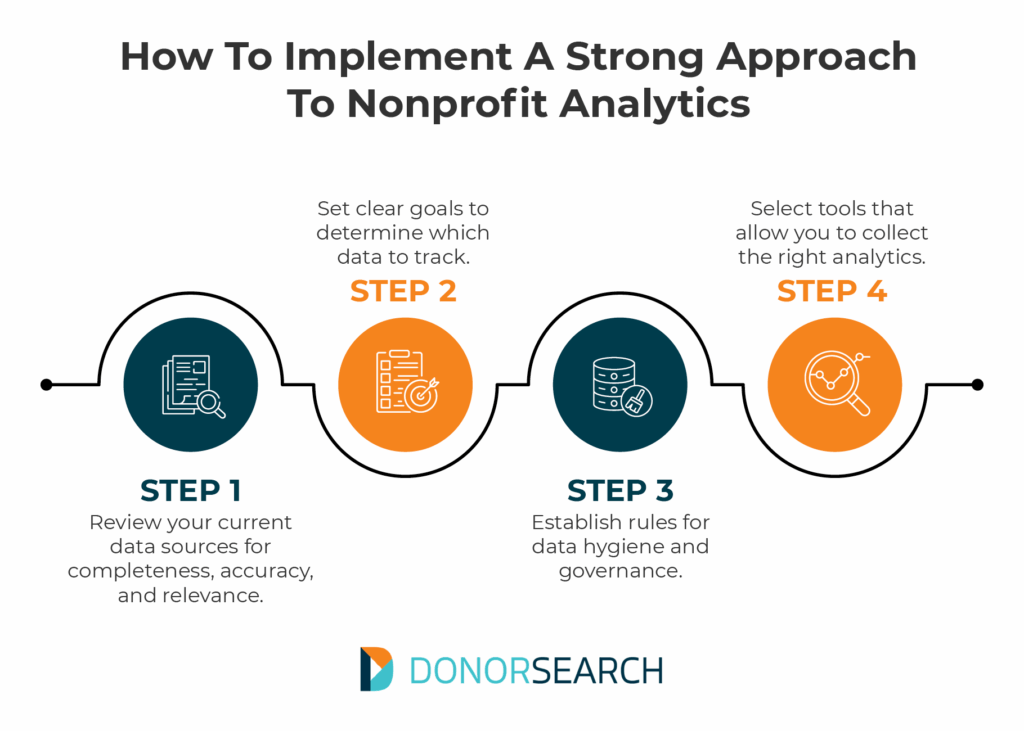
- Audit existing data. Review all your current data sources, such as profiles in your donor database, program records, and website analytics. Determine whether your data is complete, accurate, and relevant.
- Set clear goals. With your organization’s current strategic plan in mind, decide if you’re aiming to improve donor retention, optimize program impact, streamline operations, or achieve another objective. Clear goals guide what data to track and how to analyze it.
- Establish rules for data hygiene and governance. Create policies for maintaining high-quality data, including regular updates, validation processes, and data privacy standards. Ensure compliance with legal and ethical guidelines as you draft your internal rules, especially regarding donor information and AI technology use.
- Select tools that align with your goals and capacity. The right mix of tools for your needs might include CRM systems to manage donor data, dashboards for real-time tracking, analytics platforms for deeper insights, and AI-powered solutions (like DonorSearch’s tools!) to identify high-potential donors. Prioritize tools that integrate with your existing systems to streamline workflows.
The tools you’ll need will depend on the specific metrics you’re tracking. For instance, DonorSearch Ai provides predictive analytics related to donor giving, helping you prioritize the highest-potential relationships. Meanwhile, Google Analytics monitors website data, helping you enhance your site’s user experience and overall performance.
Remember that your analytics should always serve your mission, whether by improving programs or supporter engagement. Starting with these foundational steps will help turn scattered data into organized insights.
Building a Data Culture
Building a strong data culture across every team at your nonprofit will help unlock the full potential of your data analytics. It starts with training staff at all levels to understand and confidently use data in their daily work.
Encouraging open communication around data insights helps make informed decision-making a natural part of your organization’s operations. You’ll also want to foster an organization-wide commitment to ethical data use, so you can build trust with donors, beneficiaries, and other stakeholders.
How DonorSearch Can Streamline Your Nonprofit’s Analytics
Effective tools will help track the right metrics and transform raw data into meaningful insights. In addition to our leading prospect research database, DonorSearch offers AI-driven tools designed to empower your nonprofit with actionable insights for identifying and engaging your high-potential donors.
By integrating predictive and generative AI technologies, DonorSearch Ai (DSAi) modernizes traditional fundraising approaches. It can help you:
- Identify high-potential donors. Predictive scores help you focus on prospects most likely to give.
- Accelerate your major gift pipeline. Streamline the cultivation process and reduce the time from identification to solicitation.
- Optimize your fundraising strategies. Our tools assist in determining optimal ask amounts, the best times for outreach, and the most effective channels.
- Boost donor retention. Custom models accurately predict repeat donors, enhancing stewardship efforts.
Not to mention, our tools adhere to ethical AI practices, ensuring data privacy and transparency, so you can relax knowing your data is protected.
Check out this video to learn more about one organization’s journey with DonorSearch Ai:
In addition to DSAi, we offer a few other AI-powered tools to meet nonprofits where they are in their analytics journey, including:
- Enhanced CORE: This lite version of DSAi offers essential predictive modeling capabilities with preset metrics and point-and-click functionality. It’s an ideal entry point for nonprofits beginning to explore AI, offering insights into donor potential with less complexity.
- ProspectView Online 2 (PVO2): This advanced prospect reporting tool combines lightning-fast data access with AI-driven insights. PVO2 enables nonprofits to uncover top fundraising opportunities through features like individual donor reports, customizable dashboards, and predictive scoring.
Book a free demo to learn more and discover how DonorSearch can enhance your approach to analytics!
Final Thoughts
From operational improvements to better donor engagement efforts, the right data can streamline your nonprofit’s decision-making in several ways. Remember that your technology will be instrumental in tracking and securely managing your data, so choosing advanced solutions like DonorSearch can make all the difference in your organization’s ability to drive sustainable growth.
To continue learning about nonprofit analytics and technology, check out these free resources:
- 15+ Best Prospect Research Tools to Find High-Impact Donors: Explore top-rated tools that help identify and engage high-impact donors by analyzing wealth, giving history, and philanthropic interests.
- Fundraising Intelligence: Using AI to Enhance Philanthropy: Learn how AI can enhance your fundraising strategies by predicting donor behavior and optimizing outreach.
- Wealth Screening Tools: 9 Top Picks to Unlock New Donors: Discover leading wealth screening tools for uncovering new major donor prospects.